Start with what you have.
Import a hierarchy and a connection list from CSV, or build them manually. Add your own properties for owners, tools and other context.
PROCESS & DATAFLOW EXPLORATION
Turn processes and dataflows into a picture you can explore. Move from the big picture to the dependencies behind it.
Free account · 20 processes · 40 connections per project
Built for people who need to understand the whole system.
01 / PERSPECTIVES
Keep the same hierarchy and connections. Change the perspective to suit the question.
THE CONNECTED OVERVIEW
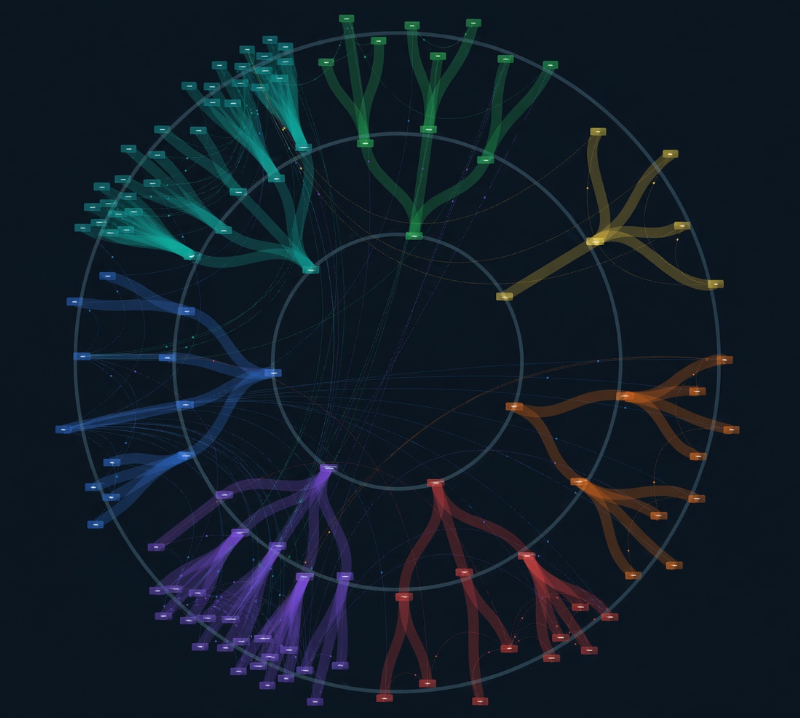
Arrange your hierarchy on concentric rings. Expand a branch, trace its inputs and outputs, and keep the wider system in view.
02 / FROM STRUCTURE TO UNDERSTANDING
A structured model you can maintain, investigate and bring into the conversation.
Import a hierarchy and a connection list from CSV, or build them manually. Add your own properties for owners, tools and other context.
Select a process to explore its upstream sources and downstream destinations. Adjust the depth to focus on the relationships that matter.
Collapse a branch for a high-level discussion. Open it to inspect the processes underneath, without maintaining a separate diagram.
Adjust colours, sizes and display settings. Save the complete project, or export hierarchy and connection tables for other work.
03 / PUT IT TO WORK
Use the map to guide discovery and discussion. Bring your process knowledge to interpret what you find.
Map the journey from operational inputs to planning, consolidation and reporting. See where spreadsheets and systems meet.
Follow connections across business areas before discussing a change. Make dependencies visible to technical and business teams.
Build a shared map with process owners. Use the hierarchy and connections to explore handoffs and challenge assumptions together.
YOUR PROJECT. ON YOUR DEVICE.
Work in your browser. Keep your project files locally.
NodeTracker saves project recovery in your browser and lets you export a complete project file. Where your browser supports it, choosing a save location enables direct file autosave.
Login and access levels use an online account service. Project content is not uploaded to that account service.
Keep a file backup: clearing browser storage can remove local recovery.
04 / YOUR FIRST MAP
You don't need to draw every connection by hand. Start with a small, familiar process.
Open NodeTracker and choose “Create a Limited account”. Confirm your email, then sign in.
Open the application ↗Create processes in Hierarchy, or import a CSV. Use Connections to link a source process to a destination.
Choose a map. Click to select, double-click to expand. Save a project file so your model and display settings travel together.
A FEW USEFUL DETAILS
A Limited account supports up to 20 processes and 40 connections in each project. Every hierarchy item counts as a process, including collapsed and hidden items. You can explore all three map types.
Full access is currently granted manually by the NodeTracker administrator. It removes the imposed process and connection count limits. Practical capacity still depends on your browser and device. Online purchasing is not available yet.
A Limited account can view and export a project above its limits. Editing is blocked until the account has Full access or you work in a project within the limits. The project is not truncated.
Live editing of a shared server-hosted dataset is not currently available. You can exchange exported project files. Each person works on their own local copy.
No. CSV import reads the file you provide. It does not create a live connection to Excel, Anaplan or other systems. The map reflects the data you maintain in the project.
Use a desktop or laptop for building and exploring complex maps. File-saving features vary by browser; a downloadable project file remains available as a portable backup.
BRING THE CONNECTIONS INTO VIEW